

May 2022 Newsletter
Welcome to May
Can you believe summer is just a little over one month away? For us here in the Pacific Northwest, it has been one of the coldest, wettest springs in history. It is nice to see the grass growing, leaves sprouting and the flowers blooming again. It reminds me that hope springs eternal, even as we enter a bear market (more on that later). Another great thing I love about May is that it signals the end of tax season. For all of us, this is a stressful time and now that 2021 tax season is officially in the books, we can glean some important information for tax planning in 2022. Our firm will be speaking with most of you about Roth Conversions and tax minimization strategies this summer. Remember, we only have until the end of 2025 to take advantage of these historically low tax codes. In 2026, if no new legislation is passed, we roll back to the Obama-era tax codes, which for most of you will mean a significant increase in your Federal taxes. Last but certainly not least, for all you mothers out there, we wanted to wish you a very Happy Mother’s Day. We hope you were spoiled on this special day.
Here is what we are covering in the May newsletter:
- Welcome to May
- Market Updates
- What the analysts are saying – Quad update
- Have you checked your beneficiaries lately?
- Social Media updates
Sell in May and Go Away??? – Market Updates
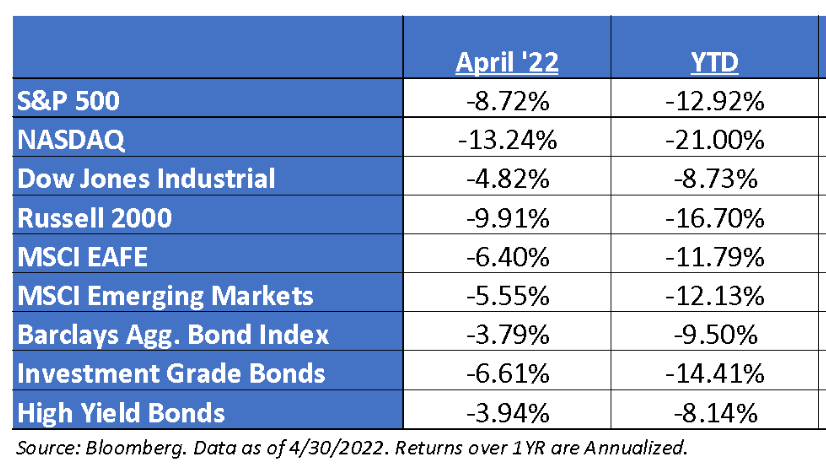
April showers doused bullish sentiment last week as the SPX wrapped up April with an 8.8% decline. This was the worst April return for the index since 1970 and the fourth lowest April return on record. Fear over the Fed’s plan to start tightening, mixed earnings reports, rising interest rates, and inflation anxiety kept buyers at bay. Economic data didn’t help as headline GDP unexpectedly contracted and consumer confidence faded.
The S&P 500 just suffered its 3rd worst monthly performance in the past 10 years, led by the Tech sector which had its worst month since 2008. US equities are~14% of its record high in December. Value was a clear winner, with quality again being shunned. Higher treasury yields helped underwrite dividend yield as a factor and dividend income funds. There was a sharp liquidation of $28B from equity funds overall in contrast to March. This selloff has continued into the first week of May. The age old saying, “Sell in May and Go Away” sure seems to hold true once again in 2022.
Let’s dig into the numbers…
Analysts Updates – The Fed and the US Dollar Wrecking Ball
The Fed announced a second rate hike of 50-bps on Wednesday, we think another 50-bps hike is in the cards for June, but after that the outlook is bit cloudier. The market has fully priced-in 10 rates hikes in 2022 (to the 2.50-2.75% range) and one more in 2023 which would be the fasted pace of hikes since 1989. Powell’s tone was fairly hawkish at the press conference last Wednesday and the Fed also discussed its plan to start shrinking its balance sheet (Quantitative Tightening). According to Powell, the Fed expects to start QT on June 1st at a rate of $47.5 billion per month. Finally, financial conditions have already tightened significantly, for example the pop in mortgage rates is harming housing affordability and with further Fed tightening there will be more casualties to slow the economy further.
Our analysts from Hedgeye Risk Management just updated their GIP (Growth Inflation Policy) models with an expectation of deep Quad 4 for the remainder of 2022 and even into the 1st quarter of 2023. I believe they have absolutely nailed the market forecast with their GIP model and subsequent market crash call way back in mid-January. As a result of their market forecasts, we changed our portfolio models and became very conservative and have limited our drawdowns compared to the major market indices. We anticipate keeping a cautious and conservative approach throughout 2022 and into early 2023 unless something significant changes the model projections.
Here is the latest Quad Map from Hedgeye Risk Management (X-axis = Inflation / Y-axis = GDP):
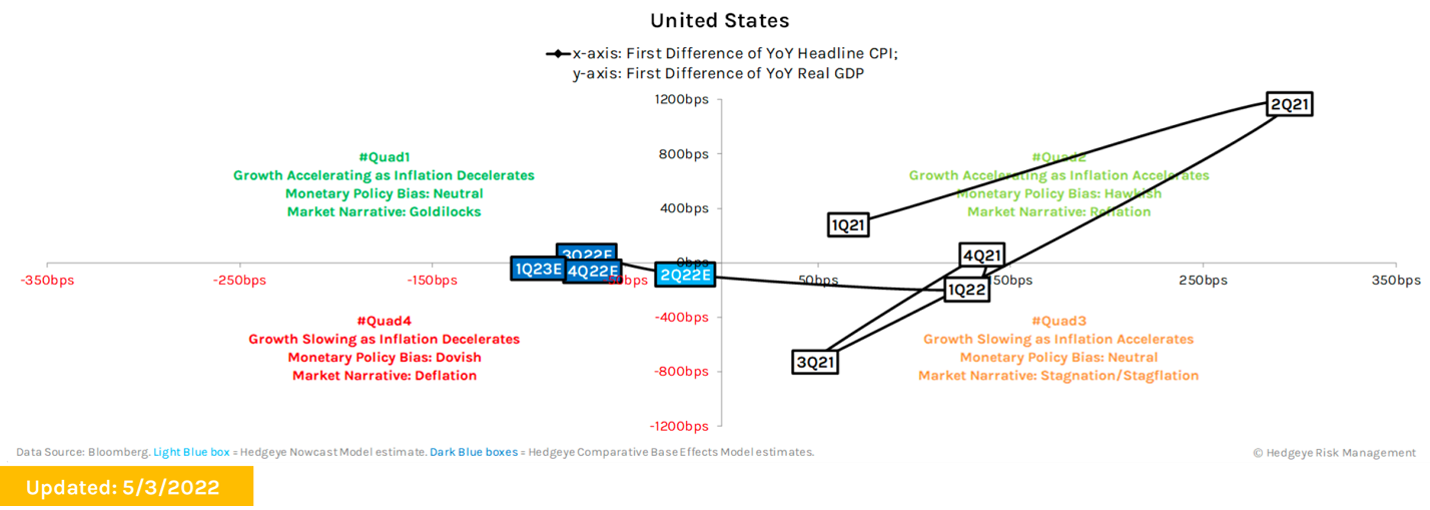
© Hedgeye Risk Management, May 3, 2022
The 30-Year Bond Bull Market is Over – Aren’t You Glad You Don’t Own Bonds
Remember in the early 1980’s when interest rates were in the high teens? My parents were telling me the other day that their first mortgage was almost 20%. Yikes!!! For 40 years, interest rates have slowly come down and bottomed out under 1% in 2020.
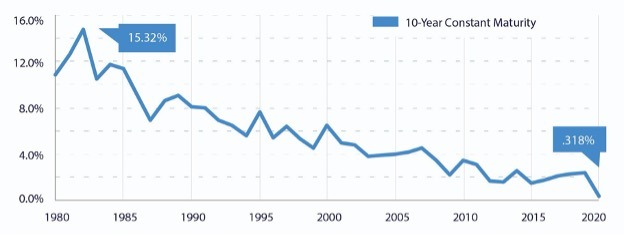
As interest rates drop, the price of bonds increases. This inverse relationship between bond prices and interest rates led to the wildly popular 60/40 portfolio rule that a lot of today’s retirees still adhere to.

If the 60% stock side of your portfolio was in correction mode, then the 40% bond side was most likely there to save the day. Now, with raging and persistent inflation, rates have started to climb rather quickly. This has led to the worst year for bonds since 1842 (-12% YTD). (see chart below)
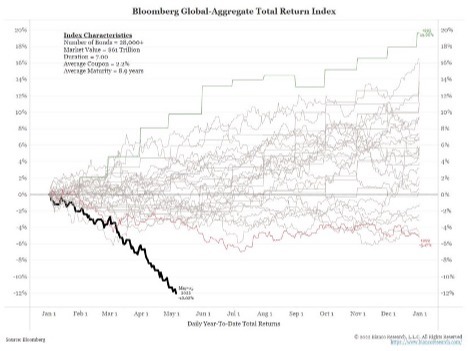
So, what do you do when both your stocks and your bonds are getting clobbered in today’s volatile markets? This is the current dilemma for many of today’s retirees. This is why we have been such strong proponents of the Fixed Index Annuity strategy as an alternative to bonds. Fixed Index Annuities are not tied directly to interest rates like bonds, yet can provide the downside protection today’s bond holders are sorely missing out on. Remember, with Fixed Index Annuities you can lock in any gains each year without the fear of giving all those gains back when the markets inevitably correct. With more than 8 more 25 BPS rate hikes expected this year, there appears to be a lot more pain in the bond market.
Thank You for Trusting Us
What an honor it is to serve our fine clients. It’s a job that we don’t take lightly. One item I would like our clients to take a closer look at as we head into summer is to make sure your beneficiaries are setup correctly on all of your TD Ameritrade accounts as well as your Fixed Index Annuities and Life Insurance policies. Please take a minute to log into your accounts at www.advisorclient.com and review that your primary and contingent beneficiaries are 100% accurate.
This is also a great time to start thinking about updating your estate planning documents such as Wills and Trusts. One thing that Covid has taught us is that life can turn on a dime and not having an updated will or estate plan can leave your loved ones scrambling to make sense of it all. If you are one of our clients who reside in Washington State, we have a wonderful estate planning attorney we would be more than happy to put you in touch with. He is not only a client of ours, but he has also helped many of our local clients get a much needed will or trust setup at an affordable price.
For those of our clients outside of Washington state, please contact Kyle Appelbaum, who is a financial advisor with Abraham & Co., Inc. in our Spokane branch office. Kyle has helped many of our clients across the country establish wills and trusts.
Thank you so much and God bless.
Darrin McComas
Disclosures
This commentary offers generalized research, not personalized investment advice. It is for informational purposes only and does not constitute a complete description of our investment services or performance. Nothing in this commentary should be interpreted to state or imply that past results are an indication of future investment returns. All investments involve risk and unless otherwise stated, are not guaranteed. Be sure to consult with an investment & tax professional before implementing any investment strategy.
Past performance is not indicative of future results. This material is not financial advice or an offer to sell any product. The information contained herein should not be considered a recommendation to purchase or sell any particular security. Forward looking statements cannot be guaranteed.
The S&P 500® is widely regarded as the best single gauge of large-cap U.S. equities. There is over USD 11.2 trillion indexed or benchmarked to the index, with indexed assets comprising approximately USD 4.6 trillion of this total. The index includes 500 leading companies and covers approximately 80% of available market capitalization.
The Nasdaq Composite Index measures all Nasdaq domestic and international based common type stocks listed on The Nasdaq Stock Market. To be eligible for inclusion in the Index, the security’s U.S. listing must be exclusively on The Nasdaq Stock Market (unless the security was dually listed on another U.S. market prior to January 1, 2004 and has continuously maintained such listing). The security types eligible for the Index include common stocks, ordinary shares, ADRs, shares of beneficial interest or limited partnership interests and tracking stocks. Security types not included in the Index are closed-end funds, convertible debentures, exchange traded funds, preferred stocks, rights, warrants, units and other derivative securities.
The Dow Jones Industrial Average® (The Dow®), is a price-weighted measure of 30 U.S. blue-chip companies. The index covers all industries except transportation and utilities.
The Russell 2000® Index measures the performance of the small-cap segment of the US equity universe. The Russell 2000® Index is a subset of the Russell 3000® Index representing approximately 10% of the total market capitalization of that index. It includes approximately 2,000 of the smallest securities based on a combination of their market cap and current index membership. The Russell 2000® is constructed to provide a comprehensive and unbiased small-cap barometer and is completely reconstituted annually to ensure larger stocks do not distort the performance and characteristics of the true small-cap opportunity set.
The MSCI EAFE Index is an equity index which captures large and mid-cap representation across 21 Developed Markets countries*around the world, excluding the US and Canada. With 902 constituents, the index covers approximately 85% of the free float-adjusted market capitalization in each country.
The MSCI Emerging Markets Index captures large and mid-cap representation across 26 Emerging Markets (EM) countries*. With 1,387 constituents, the index covers approximately 85% of the free float-adjusted market capitalization in each country.
The Bloomberg Barclays U.S. Aggregate Bond Index is a broad-based benchmark that measures the investment grade, U.S. dollar-denominated, fixed-rate taxable bond market. This includes Treasuries, government-related and corporate securities, mortgage-backed securities, asset-backed securities and collateralized mortgage-backed securities. ACA-2201-1.
© 2022 Abraham Co.. All Rights Reserved.
Investing involves risk and potential loss of principal. There can be no assurance that any investment will achieve its stated objectives. TD Ameritrade Clearing, Inc. (“TD Ameritrade”) is the firm that we use to custody our client assets. TD Ameritrade and Abraham & Co. Inc. are separate and unaffiliated firms, and are not responsible for each other’s services or policies. TD Ameritrade does not endorse or recommend any advisor and the use of the TD Ameritrade logo does not represent the endorsement or recommendation of any advisor. Brokerage services provided by TD Ameritrade Institutional, Division of TD Ameritrade, Inc., member FINRA/SIPC. TD Ameritrade is a trademark jointly owned by TD Ameritrade IP Company, Inc. and The Toronto-Dominion Bank. Used with permission.