

January 2022 Newsletter
Happy January!
We hope you had a blessed holiday season and are enjoying this season of life. While 2021 was a difficult year as we all dealt with the pandemic and its impact on our daily lives, we are so excited for what 2022 has in store. We feel we are better equipped than ever to serve our clients and exceed your expectations. One of our top goals is to improve our level of communication with clients. As part of that goal, we are going to deliver a monthly newsletter that contains timely information about Social Security, Taxes, the markets, and the state of the economy.
Here is what we are covering in January’s newsletter:
· Market Updates – Rearview to Windshield
· Analysts Updates – Quad update
· Tax Documents from TD Ameritrade
· Social Media updates (website, LinkedIn, Facebook, and YouTube)
Market Updates – Rearview to Windshield
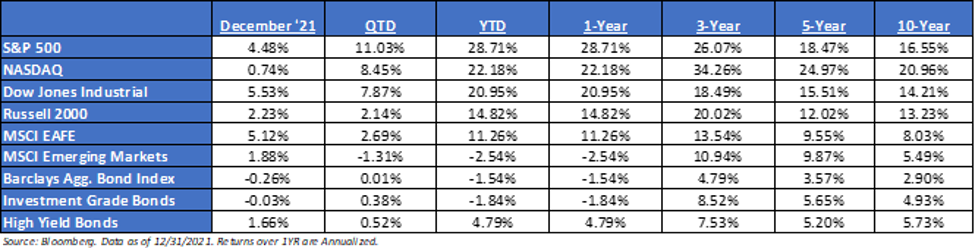
· Monthly Recap: Do you believe in Santa Claus? The market obviously did, as December, which tends to be a seasonally strong month, saw the S&P 500 rally 4.5%. With the S&P 500 finishing the year up 28.71%, 2021 ranked as the 21st best year for the index since 1926. It was also the 36th time that the total return was greater than 20%. With another year of superlatives, the market totaled 70 new all-time highs during the year – only trailing 1995 for most ever (77). Historically, when the number of new highs has been at elevated levels, the market has gone through a stretch in the following years of more new highs.
· Yearly Recap: The S&P 500 posted a total return of 28.71%, just slightly ahead of the Nasdaq and the Russell 1000 Growth Index, followed by the Russell 1000 Value Index. Bitcoin –perhaps the ultimate risk asset –soared by 60%. However, the Russell 2000 small cap benchmark and the High Yield credit index, both often viewed as a proxies for risk, returned just 14.82% and 4.79%, respectively. Defensive assets such as Investment-Grade bonds, US Treasuries, and Gold, all posted negative returns at -1.84%, -4.65%, and -3.55%, respectively
· Where Do We Stand? The path of least resistance has been higher in recent weeks, but there are a lot of moving pieces for the market to deal with – just look at the recent volatility. 1) Introduction of the Omicron variant 2) A potentially more hawkish Fed – Jerome Powell said that he would “consider” speeding up the pace of tapering and that it’s time to “retire” the word “transitory” when referring to inflation. Not to forget, the potential for increased political volatility – Congress did not pass the Build Back Better legislation in 2021, a mid-term election year.
· Equity Fundamentals: As equity valuations come under scrutiny amid the rapid rise in real rates, investor focus will increasingly assess whether earnings growth can continue to lead the market higher. We are focusing on Q4 2021 earnings, which will begin in early February. As of year-end, the consensus estimates expect S&P 500 EPS to increase +9% in 2022. We believe there is upside to consensus estimates but expect the frequency and magnitude of EPS beats will moderate from 1H 2022. There remain a few key risks to watch: (1) Supply chains, (2) oil, (3) labor costs, (4) Fed tapering cadence, (5) Omicron variant, and (6) China growth.
· The Fed Announced a Tapering Plan: As expected, the Federal Reserve officially announced the beginning of a tapering process to start last November at $15B/month. In December, Fed Chairman Jerome Powell announced that this cadence will double beginning in 2022 – ultimately concluding in late March ’22. This was somewhat expected by the market, as Fed Chair Powell continued to see strong economic data, alongside decade-high inflation readings. Even though the Fed increased their tapering cadence, they remain very dovish when it comes to interest rate hikes, i.e., liftoff. The market is currently pricing in three rate hikes next year and four in 2023.
Talking Points – January 2022
· Though it wasn’t passed in 2021, President Biden outlined the biggest expansion of the federal government matched with the largest tax increase since 1968. Biden senses the post-COVID era is a once-in-a-generation opportunity to massively restructure US fiscal, monetary, and social policy. In our opinion, this is a big experiment. We’ll wait to see how the Build Back Better plan and taxes pan out. It appears that this dramatic change in societal direction has proved to be difficult for some moderate Democrats to get on board, i.e., Manchin.
· We have expected bond yields to reflate as the pandemic improves and economic activity begins to normalize. The spread on the 2s and 10s has historically expanded as wide as 300 bps (~84bps as of December month-end). This year’s peak was in March at ~160bps.
· With the recent Merck /Pfizer Therapeutic news, we believe that this should create an environment of increased optimism surrounding the resumption of normal economic activity, our expectation is that rates will continue to rise, and market leadership will shift away from Tech Growth into more downtrodden components of the market.
· This past year was led by a bunch of one-hit wonders, i.e., most likely not repeatable – a very dovish Fed, a successful economic reopening, and $8T of stimulus. None of which are expected to sustainably pump liquidity into the market next year. In 2022, the market may have to navigate a slew of negative headlines – increased taxes, higher-than-expected inflation, continued supply bottlenecks, and the possibility of more variants. All in all, we believe that this can create an environment of increased volatility.
· We feel it will be worth watching the general trend of economic and fundamental data, and when it will begin to decelerate.
· Longer-term, we believe valuations and bond yields will eventually matter, and both will lower expected returns for balanced portfolios.
Analysts Updates – What the data is telling us
The multi-quarter reflationary bonanza is now rearview. According to the analysts we subscribe to, it gets harder from here and more active macro risk management will take sharper focus. It also appears that inflation is set to peak and roll over in the coming months. While absolute levels of inflation will remain high for some time, the analysts see the beginning of disinflationary pressures emerging over the course of the first half of 2022.
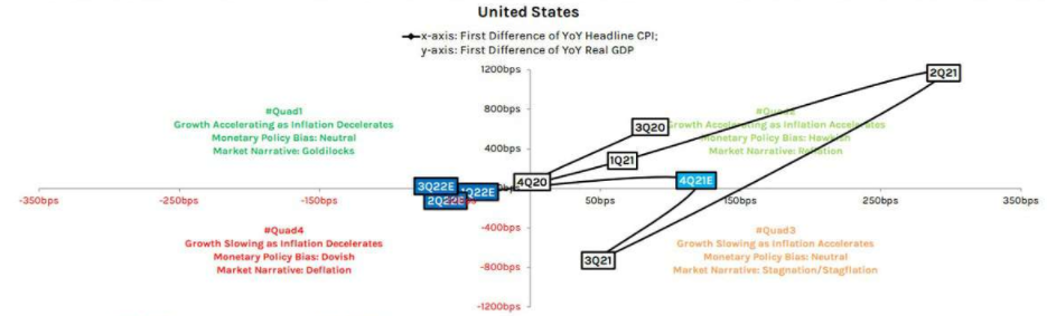
If you examine the chart above, you can see that we are in the middle of a transition into a very narrow Quad 1 in the 1st Quarter of 2022. It does look like the data is pointing to a Quad 4 (narrow) in the 2nd Quarter of 2022 and back to a narrow Quad 1 in the 3rd Quarter. Quad 1 is generally pretty bullish for the markets while Quad 4 is just the opposite. The good news as of today is that it appears to be a very narrow/shallow Quad 4. If the Fed decides to tighten AND raise interest rates into an economic slow down in the 2nd Quarter, then the probability of a much deeper Quad 4 increases dramatically. Deep Quad 4 events typically are accompanied by significant drops in the market and increased volatility across most asset classes. We are keeping a very close eye on what the Fed is up to and will be ready to make asset allocation changes to your portfolios if the data warrants such a pivot.
Taxes

Would you like a second opinion on your 2021 taxes before you file them with the IRS? We recently purchased access to an amazing tax planning tool by Holistiplan. With this service, we can immediately identify key income break points for tax planning opportunities like ROTH conversions, tax-efficient withdrawals, charitable giving, and much more. We are offering this service to ALL of our clients 100% FREE OF CHARGE. For more information, just let us know you are interested in the Holistiplan service and we will reach out to you for a copy of your tax return PRIOR to you sending it in to the IRS.
Tax Updates – Tax Documents from TD Ameritrade
To help make sure you receive your tax documents as soon as they are available, please sign up for electronic tax form delivery. You can sign up for e-delivery of tax documents by logging into www.advisorclient.com, then click My Profile > Communication Preferences.
You can find the tax documents on advisorclient.com by simply clicking the appropriate document on the Statements & Tax Documents menu.
We have listed useful information below pertaining to the anticipated dates our 2021 Consolidated Form 1099s will be available to be viewed online.
Timing of Available Tax Documentation
WAVE 1
Target Delivery Date: Close of business January 21, 2022
Details; No holdings subject to reallocation (ex. RICs, REITs)
WAVE 2
Target Delivery Date: Close of business February 4, 2022
Details: Low risk for reallocation; income reallocations finalized through January 29th
WAVE 3
Target Delivery Date: Close of business February 11, 2021
Details: Clients with finalized income reallocations received from January 30th through February 3rd
WAVE 4
Target Delivery Date: Close of business February 17, 2022
Details: Remaining clients
■ Correction Cycles – Begins March 3, 2022 and occurring every 2 weeks through April 14, 2022
All dates are estimates and subject to change
■ 1099 Notification: Once these 1099s have been posted online, TD Ameritrade will notify you that they are available. Clients that have enrolled to receive their 1099's online, will also receive an e-mail notification addition, this information will be posted to the Latest Announcements section of Veo One®.
■ For clients receiving paper documents they should allow several days for mail delivery after these forms have been posted online.
Thank You for Trusting Us
We would personally like to thank you for trusting Abraham & Co. with your retirement. We love our clients and strive to treat each and every one of you like family. Your success is our success. If you ever need anything, please don’t hesitate to reach out to us. Here’s to a very blessed 2022!
Sincerely,
Darrin McComas
Chief Investment Officer
Disclosures
This commentary offers generalized research, not personalized investment advice. It is for informational purposes only and does not constitute a complete description of our investment services or performance. Nothing in this commentary should be interpreted to state or imply that past results are an indication of future investment returns. All investments involve risk and unless otherwise stated, are not guaranteed. Be sure to consult with an investment & tax professional before implementing any investment strategy.
Past performance is not indicative of future results. This material is not financial advice or an offer to sell any product. The information contained herein should not be considered a recommendation to purchase or sell any particular security. Forward looking statements cannot be guaranteed.
The S&P 500® is widely regarded as the best single gauge of large-cap U.S. equities. There is over USD 11.2 trillion indexed or benchmarked to the index, with indexed assets comprising approximately USD 4.6 trillion of this total. The index includes 500 leading companies and covers approximately 80% of available market capitalization.
The Nasdaq Composite Index measures all Nasdaq domestic and international based common type stocks listed on The Nasdaq Stock Market. To be eligible for inclusion in the Index, the security’s U.S. listing must be exclusively on The Nasdaq Stock Market (unless the security was dually listed on another U.S. market prior to January 1, 2004 and has continuously maintained such listing). The security types eligible for the Index include common stocks, ordinary shares, ADRs, shares of beneficial interest or limited partnership interests and tracking stocks. Security types not included in the Index are closed-end funds, convertible debentures, exchange traded funds, preferred stocks, rights, warrants, units and other derivative securities.
The Dow Jones Industrial Average® (The Dow®), is a price-weighted measure of 30 U.S. blue-chip companies. The index covers all industries except transportation and utilities.
The Russell 2000® Index measures the performance of the small-cap segment of the US equity universe. The Russell 2000® Index is a subset of the Russell 3000® Index representing approximately 10% of the total market capitalization of that index. It includes approximately 2,000 of the smallest securities based on a combination of their market cap and current index membership. The Russell 2000® is constructed to provide a comprehensive and unbiased small-cap barometer and is completely reconstituted annually to ensure larger stocks do not distort the performance and characteristics of the true small-cap opportunity set.
The MSCI EAFE Index is an equity index which captures large and mid-cap representation across 21 Developed Markets countries*around the world, excluding the US and Canada. With 902 constituents, the index covers approximately 85% of the free float-adjusted market capitalization in each country.
The MSCI Emerging Markets Index captures large and mid-cap representation across 26 Emerging Markets (EM) countries*. With 1,387 constituents, the index covers approximately 85% of the free float-adjusted market capitalization in each country.
The Bloomberg Barclays U.S. Aggregate Bond Index is a broad-based benchmark that measures the investment grade, U.S. dollar-denominated, fixed-rate taxable bond market. This includes Treasuries, government-related and corporate securities, mortgage-backed securities, asset-backed securities and collateralized mortgage-backed securities. ACA-2201-1.
© 2022 Abraham Co.. All Rights Reserved.
Investing involves risk and potential loss of principal. There can be no assurance that any investment will achieve its stated objectives. TD Ameritrade Clearing, Inc. (“TD Ameritrade”) is the firm that we use to custody our client assets. TD Ameritrade and Abraham & Co. Inc. are separate and unaffiliated firms, and are not responsible for each other’s services or policies. TD Ameritrade does not endorse or recommend any advisor and the use of the TD Ameritrade logo does not represent the endorsement or recommendation of any advisor. Brokerage services provided by TD Ameritrade Institutional, Division of TD Ameritrade, Inc., member FINRA/SIPC. TD Ameritrade is a trademark jointly owned by TD Ameritrade IP Company, Inc. and The Toronto-Dominion Bank. Used with permission.